Engineering notes from a personal hobby project. Validation results are drawn from project documentation; hardware status is stated below.

Preserve playback while observing the signal
The spectrum project targets the original Zybo and its SSM2603 audio codec. Stereo LINE IN feeds a 24-bit I²S loopback to HPH OUT at approximately 48 kHz. A sample tap publishes complete left/right pairs without changing that playback path. For analysis, the upper 16 bits of each channel are averaged using a wider intermediate sum. This produces a mono analysis signal; opposite-phase stereo content can cancel in the mix even though headphone playback preserves both channels.
A bounded fixed-point transform
The analyzer captures 256 consecutive samples, applies a Hann window, and executes an eight-stage radix-2 FFT. Coefficients are Q15 constants, and the transform reuses four complex-product multipliers with a sample RAM. Dividing each butterfly result by two provides overall 1/256 normalization and keeps the real and imaginary values bounded. The analyzer pauses sample capture during computation, then starts another contiguous block. That skips some analysis samples between blocks without interrupting playback.
Turn FFT bins into readable bars
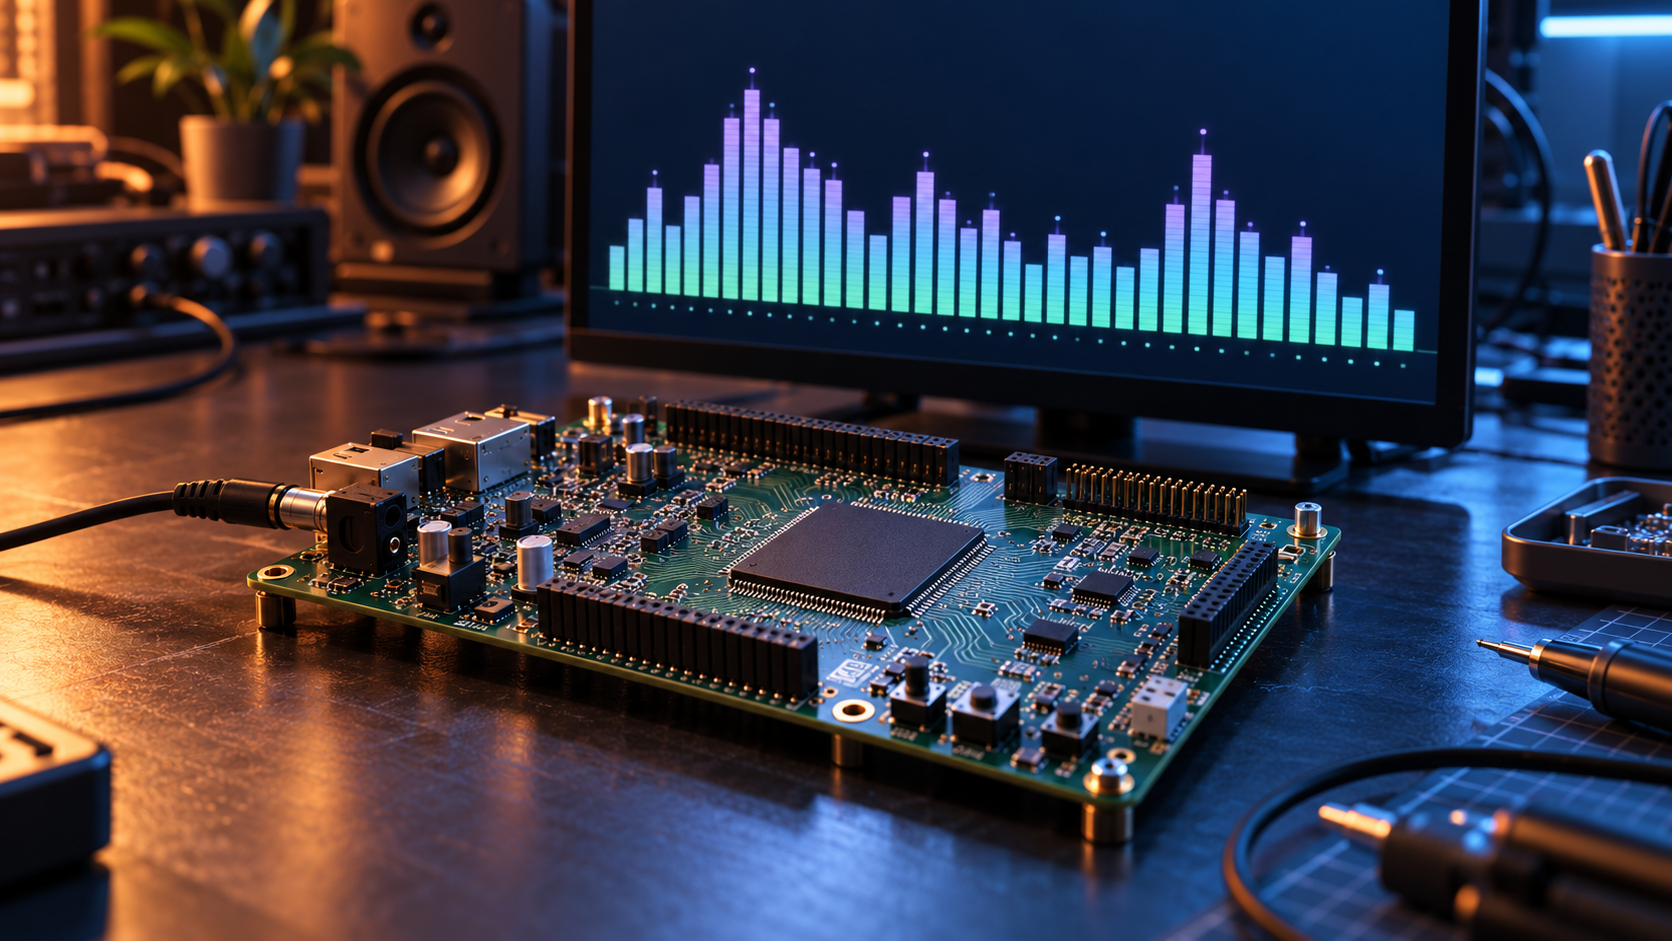
The display groups the 128 positive-frequency bins into 32 bars, excluding DC. Each group uses the strongest approximate magnitude, calculated as the sum of the absolute real and imaginary components. With the documented sample rate, the bin spacing is approximately 187.51 Hz and each four-bin group spans about 750 Hz. The bars use a linear frequency scale and logarithmic amplitude presentation; they are not a calibrated dBFS measurement. Peak markers and controlled decay make the display easier to follow.
Transfer complete results between clocks
Audio samples, FFT processing, and HDMI pixels occupy different clock domains. Complete stereo pairs and complete bar snapshots cross through acknowledged XPM handshakes. The sender holds its data until acknowledgement, keeping each transfer coherent. The display accepts the newest complete result during vertical blanking so a single frame does not combine different spectrum updates. Analysis updates arrive roughly 185 times per second, while the video output runs at approximately 59.975 frames per second.
Validation and the next hardware check
The repository records 13 selected passing VUnit tests, including comparisons against an independent floating-point windowed DFT. Tests cover tones, silence, full-scale inputs, busy-input rejection, reset, and video timing. Recorded Vivado results include successful bitstream generation, +0.247 ns setup slack, +0.038 ns hold slack, and eight DSPs used. These results were not rerun for this article. Combined hardware operation still needs testing. A useful board check starts with silence and known-frequency tones, checks the expected bands, and confirms that audio playback stays continuous. HDMI carries the visualization only; audio remains on HPH OUT.
RELATED PROJECT
View the project case study →